In this first tutorial I am going to explain how a player’s scoring statistics create movement in their stock price as they play games in the playoffs. The points a player scores in each game are factored in to the price of their stock which causes it to move up or down, depending on how many points they scored. Both goals and assists are weighted equally.
All of the price information for any player is shown in a chart like the one below. I’ll walk you through what all of those lines, bars and numbers mean so it makes sense.

The name of the player, the team they play for and the playoff year are all in the heading. The red line with all of the little numbers above it show the price of the player’s stock over time. The scale for the stock price is on the left side. It will look different depending on how much the price of the player’s stock moved over time. Every chart will have 28 possible entries which represents the maximum number of games in a playoff season that can be played ( 4 rounds of 7 games each ).
The dark blue bars along the bottom represent the number of points a player scored in any 1 game. For example, in the chart above, Marchand scored 1 point in game 1 and 2 points in game 2. The little light blue bars sitting on top of the dark blue bars represent bonus points for games and playoff series the player’s team won. In each successive round, the bonus points get higher for games and playoff series won. ( See rules page )
The system that turns a player’s scoring statistics into a stock price also rewards consistency and penalizes inconsistency. So if a player is scoring points in consecutive games, their stock price will go up more than if they are not. It will also penalize players if they are not scoring in consecutive games.
How much a player’s stock price goes up or down also depends on the number in red that you can see in the lower left hand corner of the chart.

This number is the benchmark that their scoring is measured against and is simply their regular season scoring shown as their points per game. The higher this number, the more they have to score in the playoffs to make their stock price go up. The lower the number, the less they have to score. No matter how high or low this benchmark number is however, they have to score at least 1 point in a game in order for their stock price to increase.
A player with a lower benchmark number will have their price increase by more than another player with a higher benchmark. The whole point to this is to level the playing field enough so that it is possible to realize gains from both higher and lower scoring players. I think this will make the game more interesting and more fun to play by bringing in many more players into the market that otherwise wouldn’t be worth investing in if their scoring was all weighted equally.
So the benchmark number is important to keep in mind as far as evaluating which players may be worth investing in, or which players may be ones you want to avoid because their benchmark is high in relation to their playoff scoring prospects. I’ll show you some examples to help explain how this works.
The first player we’re going to look at is Ryan O’Reilly from the St. Louis Blues in 2019.
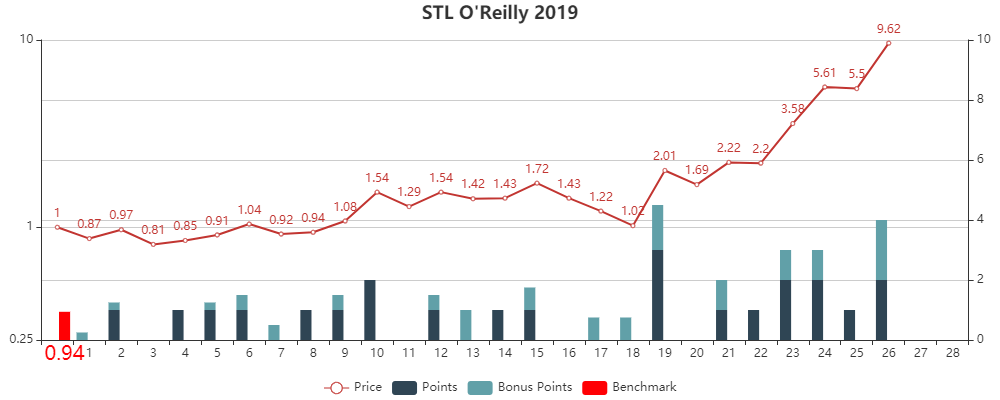
He was the highest scoring member of the team in the playoffs. He was also the teams’ highest scoring player in the regular season, with .94 points per game. That’s his benchmark number. In the playoffs he scored 23 points in 26 games, which was very close to his regular season scoring pace. So his scoring was high enough to keep his stock price pretty level but not high enough to move it much higher. That is until late in the playoffs when bonus points for wins got higher, and he started scoring more consistently than he had been earlier in the playoffs. You can see both his points in individual games ( dark blue bars ), and his bonus points for any games his team won (light blue bars ) at the bottom of the chart. The light blue bars for bonus points are stacked on top of the dark blue bars for points if they had both types of points in any one game.
As you can see from this example, O’Reilly’s stock price barely moved for the first 18 games he played because even though he was scoring, it was usually only 1 point in a game, and had numerous games where he didn’t score at all. The bonus points he was getting for team wins helps a little in earlier rounds, but by themselves isn’t enough to make his stock price go up. In the final 8 games he played however, he started to score multiple points, and do so with more consistency, which then cause his stock price to move up a lot over that time period. More than 9 fold in fact, which is a really solid gain for any player. He also started gaining more bonus points for wins at that point since he was now going into the finals, where bonus points are 1 full point for a win, and 2 points for winning the cup. ( See rules page )
Since his benchmark was rather high, at .94, he needed to score more than 1 point in a game with bonuses to really move his stock price up. Once he started to do that, his stock price responded accordingly. So higher scoring players need to score more points, and do so more consistently to cause their stock price to move higher. Which is what you’d expect from a higher scoring player.
Now let’s look at his teammate, Jadan Schwartz.
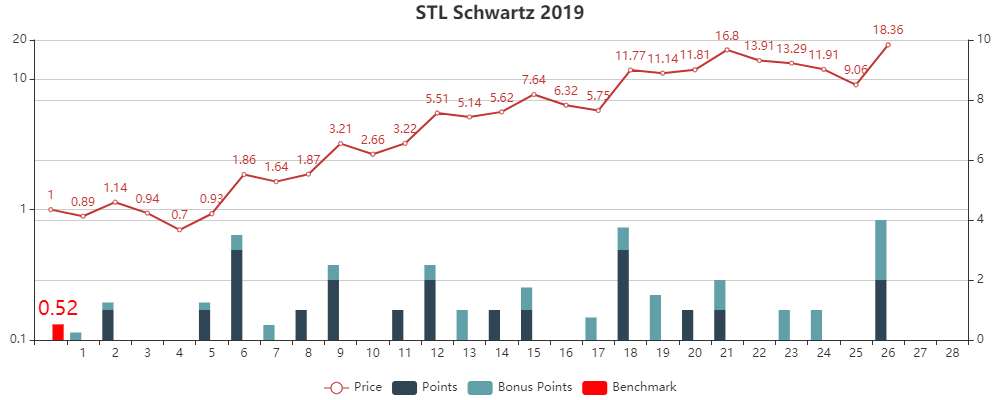
He scored nearly as many points as O’Reilly did in the playoffs, but his regular season scoring was much lower. It was only .52 points per game. This lower benchmark number means that he doesn’t have to score as many points, or as consistently as O’Reilly did to move his stock price higher. You can see that his scoring wasn’t as consistent, but when he did score, he tended to score more points. The combination of higher point totals in the games he played, and the lower benchmark number is why his stock price went up so much more than O’Reilly’s did, especially in the earlier rounds.
Actually from game 5 through game 18 he scored 15 points in 14 games, which is double the rate he was scoring in the regular season. So his stock price moved up from 70 cents to nearly 17 dollars, which is a huge move. After that his scoring dropped and other than the final game where he scored 2 points and got 2 bonus points for winning the final round, his stock price kept dropping up until that point. Getting 4 total points in the last game is the reason why his stock jumped again and doubling from that one game. Nice timing!
So this side by side comparison does a good job of showing how many points a player scores, how consistently they score, and what their benchmark is that their scoring is measured against all work together to determine movements in their stock price over time.
Points scored and consistency I think are fairly straightforward. If a player scores points, his stock price will go up, or at a minimum, not go down. If they don’t score, their price will fall. If they are scoring consistently, their price rises faster, and if they are going scoreless consistently, their price falls faster.
One more example I think will really bring home how the benchmark works where the other two factors are roughly equal. The best example I’ve found, and the most fun to look at is from 2 years ago when both Jake Guentzel and Sidney Crosby were doing their best Wayne Gretzky impersonations.
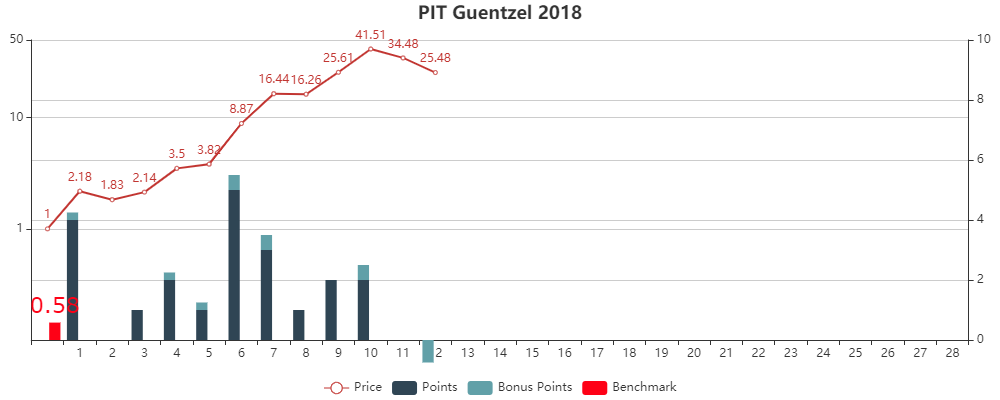
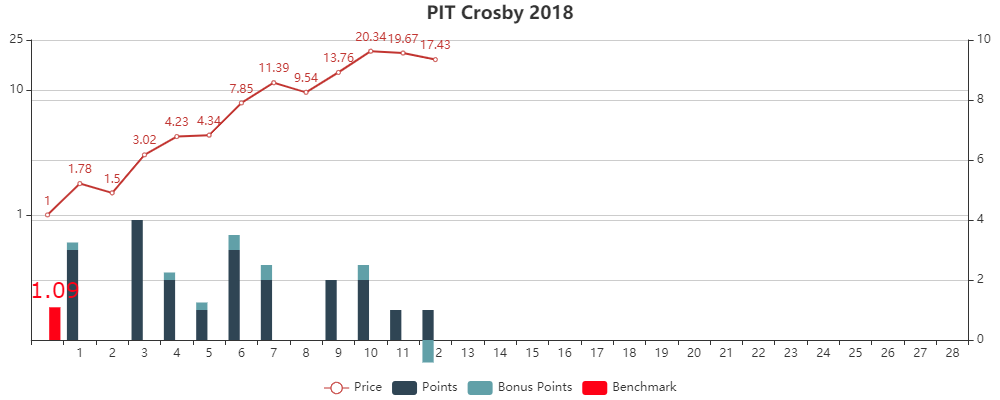
Over only 12 games in the playoffs, both of them scored an amazing 21 points! They also scored at more or less the same pace throughout the playoffs, so both points scored and consistency for these 2 players are pretty much the same. That lets us isolate their benchmarks to see how that factor alone effects their stock price. As it turns out, Crosby’s benchmark of 1.09 points per game is almost exactly double that of Guentzel’s benchmark of .58 points per game.
As you would expect, having a bar that is only half as high to jump over caused Guentzel’s price to rise about twice as much as Crosby’s did. At their peak, Guentzel’s stock price got to over $41 while Crosby’s reached just over $20. Technically Crosby had scored 2 less points than Guentzel at this point but its close enough to illustrate the impact that a player’s benchmark has on their stock price. You’ll also notice that in the last 2 games when Guentzel didn’t score, his stock price took a big hit, while Crosby’s didn’t because he scored 1 point in both of his last 2 games. They also were both further penalized .75 points for being eliminated in the 2nd round of the playoffs.
The main takeaway here is that player’s with lower benchmarks have a higher upside, but they also are riskier since lower scoring players in the regular season obviously tend to also score less in the playoffs. If they do perform above their regular season average, they can make bigger gains. Especially if this lasts over multiple games. Higher scoring players don’t have the same upside, but do tend to score more and more consistently which will also cause their price to rise, but they have to work harder to get the same gains.
Both Kuznetsov and Ovechkin’s stock prices with Washington in 2018 got to nearly $50 by the end of the playoffs despite both having benchmarks over 1 point per game. So it is possible to make big gains with higher scoring players also. It just takes longer so they normally would have to at least get to the final round, and preferably win also to get the most bonus points as well.
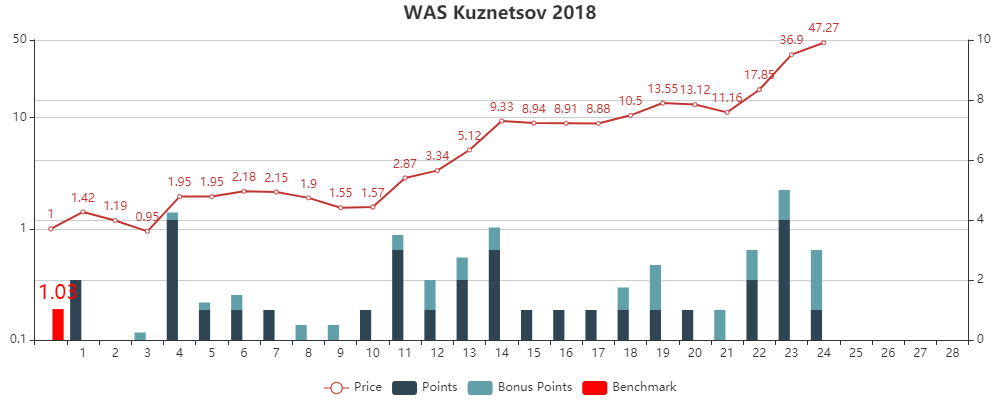
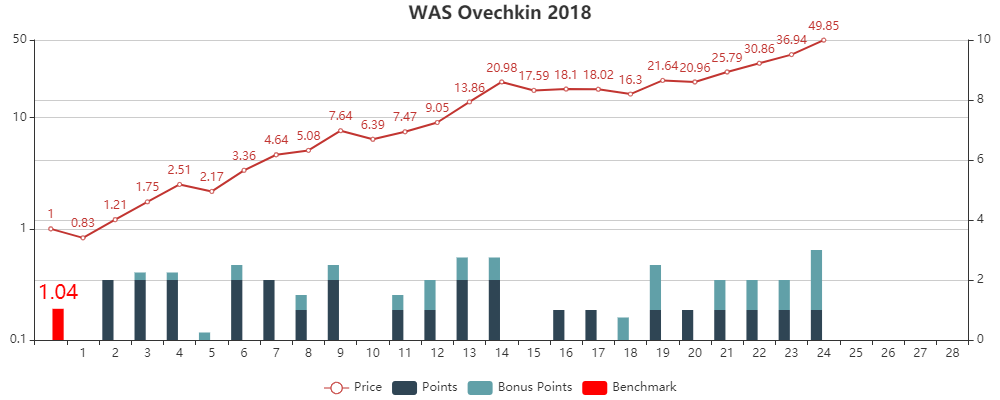
So that’s how a player’s scoring effects the price of their stock. You can view more price charts in the chart room page from 2019 and 2018 to see how different players’ stock prices performed for those playoff years.